Infographics for Lawyers
- Status: Closed
- Prize: $50
- Entries Received: 1
- Winner: W3WEBHELP

Contest Brief
I need two infographics.
Both should have the same title with our logo about it.
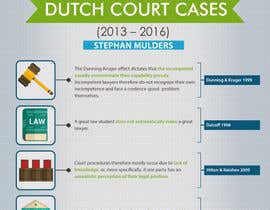
Title:
Which type of lawyer wins most cases? a quantitative study
on Dutch court cases (2013 – 2016). - Stephan Mulders
Content for infographic 1:
The Dunning-Kruger effect dictates that the incompetent usually overestimate their capability grossly. Incompetent lawyers therefore do not recognize their own incompetence and face a credence-good-problem themselves.
Dunning & Kruger 1999
A great law student does not automatically make a great lawyer. Daicoff 1996
Court procedures therefore mostly occur due to lack of knowledge, or, more specifically, if one party has an unrealistic perception of their legal position.
Hilton & Naizhen 2009
A study consisting of interviews with almost 700 judges shows that judges believe that better lawyers influence case-outcomes and that a better lawyer is more likely to obtain a favorable jury decision (in the USA). Posner & Yoon 2010
Clients mostly confine themselves to word-of-mouth referrals. Ironically, these referrals are given by other former clients who themselves cannot determine the quality of legal
advice. Couwenberg et al. 2009
Lawyers with between one and five years of experience tend to perform better in court than their more experienced counterparts. Ota 2014; Wright & Peeples 2013
Big law firms tend to be a bit pickier, trying to get only the students with the highest grades, although grades seem to be no strong indicator for lawyer effectiveness. Schultz & Sedeck 2011
Content for infographic 2:
Female lawyers show a higher dropout rate. Alarie & Adjei 2016
Female lawyers tend to make less billable hours and provide less new client revenue, which is partly caused by the structure of their organizations. Azmat & Ferrer 2015
Female lawyers tend to spend less time on their work than their male counterparts and earn significantly less.
Wallace & Young 2010
Female Plaintiff Lawyers - 15% better than Male counterparts Mulders 2016
Plaintiff Home Field Advantage - 13% Mulders 2016
Female judges tend to judge other females the same or even more lenient. Gill et al. 2015
Attached are examples of some of our other infographics. Can the 2 new infographics have a similar style?
Recommended Skills
Employer Feedback
“He was such a pleasure to work with.”
![]() jlpatter3, United States.
jlpatter3, United States.
Public Clarification Board
How to get started with contests
-

Post Your Contest Quick and easy
-

Get Tons of Entries From around the world
-

Award the best entry Download the files - Easy!