Freelancer:
hosamhasan96
Data Analysis and Data visualization for Business
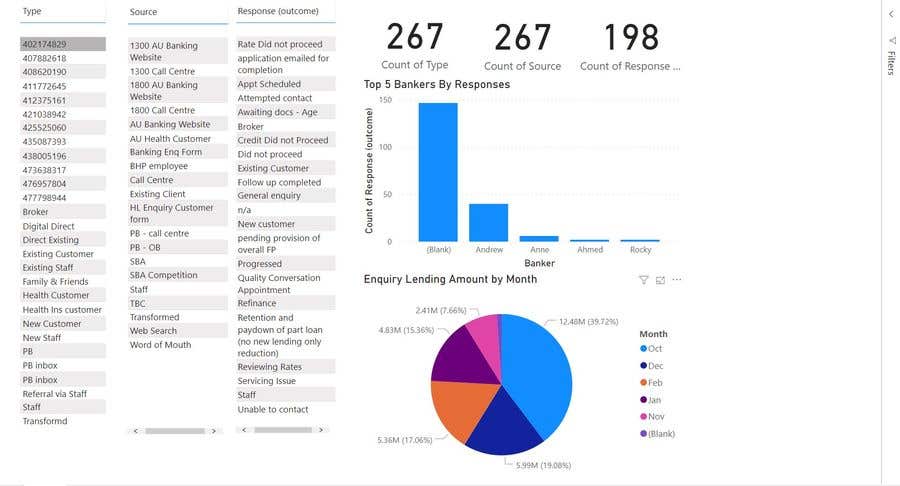
I have used power BI for data visualization showing the top 5 bankers, total loan amount for each month , etc. .A link of a video is attached in the description showing the dashboard and multiple photos. The analysis can also be done by MS Excel but I prefer Power BI for the advantage of powerful data visualization tools. Video Link: https://youtu.be/Vprr3nz9NR4


