Akshay8459
India

Trading Economics welcomes freelancers from around the world to create examples in any programming language that showcase how one can leverage our API to get data and with it display tables, charts, world maps, heatmaps, scatter plots and any other interesting visuals.
Step #1
Register for a free developer account at
https://developer.tradingeconomics.com/
Get an API Key
Step #2
Git fork existing examples at
https://github.com/tradingeconomics/tradingeconomics
Try some of them
Step #3
Check our API documentation
https://docs.tradingeconomics.com/
Step #4
Program something that leverages the usage of our API
- Can be a simple script in any programming language
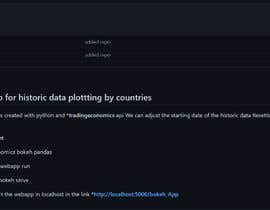
- Can be a web application using any framework
- Can be a desktop application for any Operational System
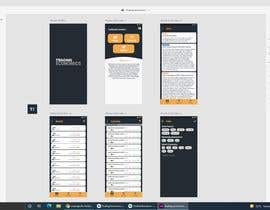
- Can also be a small mobile app for iOS or Android
Step #5
Git commit your example into the repository you created while forking our examples
Submit a screenshot of your example to Freelancer making sure you add a note with a link to your forked GitHub example in your submission
Rules
We will pick the most interesting example/app at the end of the contest
You can submit more than one example and we will consider the one we think is the best.
Only original content only. Please!
Considerations
Developer accounts are free but they only have access to a limited number of datasets. This includes all data from the Worldbank, the United Nations, the Federal Reserve, the EUROSTAT, etc. Only premium accounts have access to all the latest stats in national indicators, to our economic calendar and to real time market quotes. Therefore, you have two choices. You need to use your key and those free datasets in your examples. Or you can use a guest:guest account and try to get some limited premium data as stated in our API docs and in our GitHub examples.
About us
Trading Economics provides its users with accurate information for 196 countries including historical data and forecasts for more than 20 million economic indicators, exchange rates, stock market indexes, government bond yields and commodity prices. Our data is based on official sources, not third party data providers, and our facts are regularly checked for inconsistencies. TradingEconomics.com has received more than 1 billion page views from more than 200 countries.
https://tradingeconomics.com
The Trading Economics Application Programming Interface
The API provides direct access to our data. It allows users to download millions of rows of historical data, to query our real-time economic calendar and to subscribe to updates. Providing several request methods to query our databases, with samples available in different programming languages, it is the best way to export data in XML, CSV or JSON format. The API can be used to feed a custom developed application, a public website or just off-the-shelf software like Microsoft Excel.

Post Your Contest Quick and easy

Get Tons of Entries From around the world

Award the best entry Download the files - Easy!

